

Removing system loss stage by stage, from electrical input to useful airflow
Four technologies working together along the energy path, with data-driven O&M making the result measurable and improvable — this page sets out the principles, the limits and how it is verified.
Loss happens at every stage — so does improvement
Walk the energy path stage by stage and see exactly what the third generation changes.
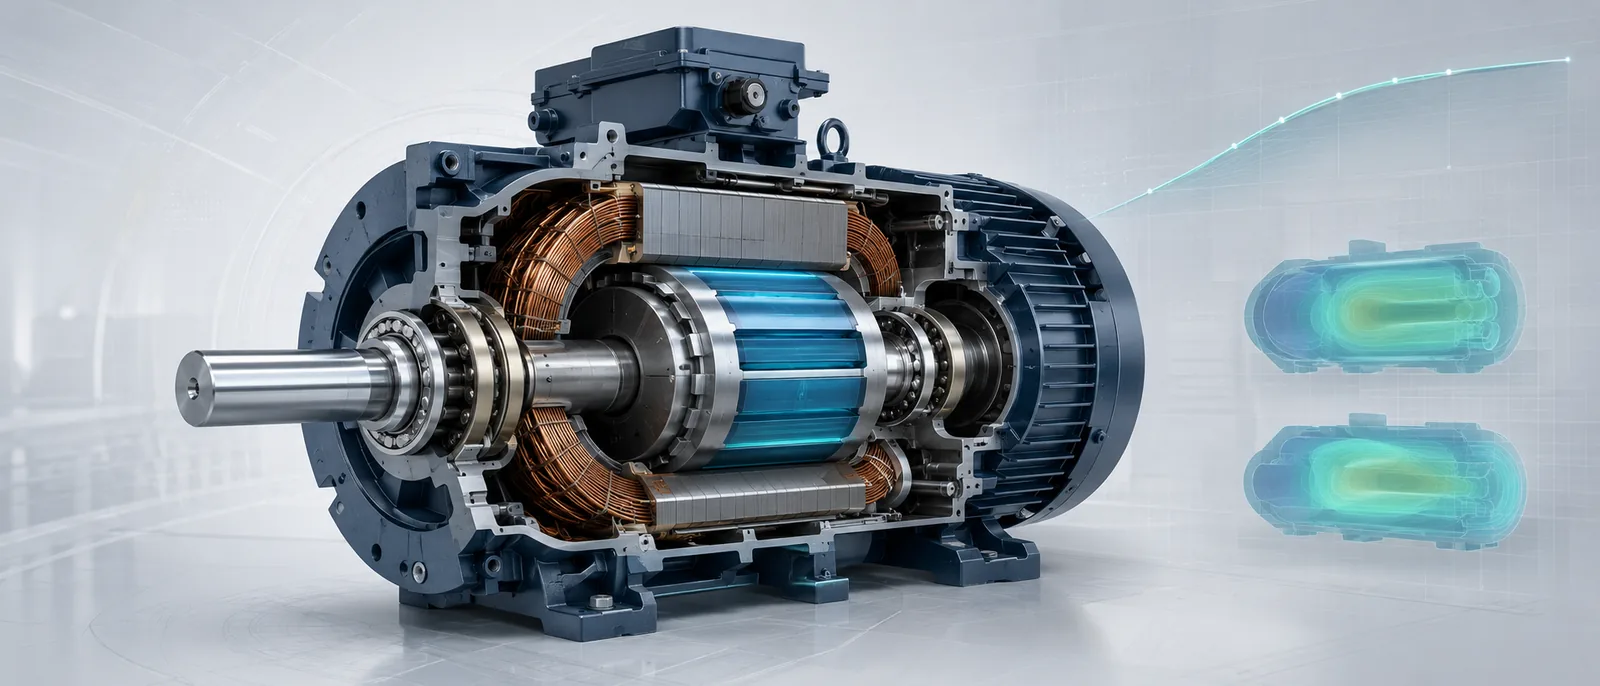
A permanent-magnet motor holds high efficiency across a wide load range
Induction motors lose efficiency sharply at part load
Each stage’s actual contribution varies with site conditions; the combined effect is not a simple sum of individual figures.
Not four selling points — one closed loop
A permanent-magnet rotor replaces induction excitation, cutting rotor loss and holding efficiency under varying load — no sharp drop-off when the load falls.
- High-efficiency plateau across a wide load range
- Better power factor and temperature rise
- A natural match for VFD control
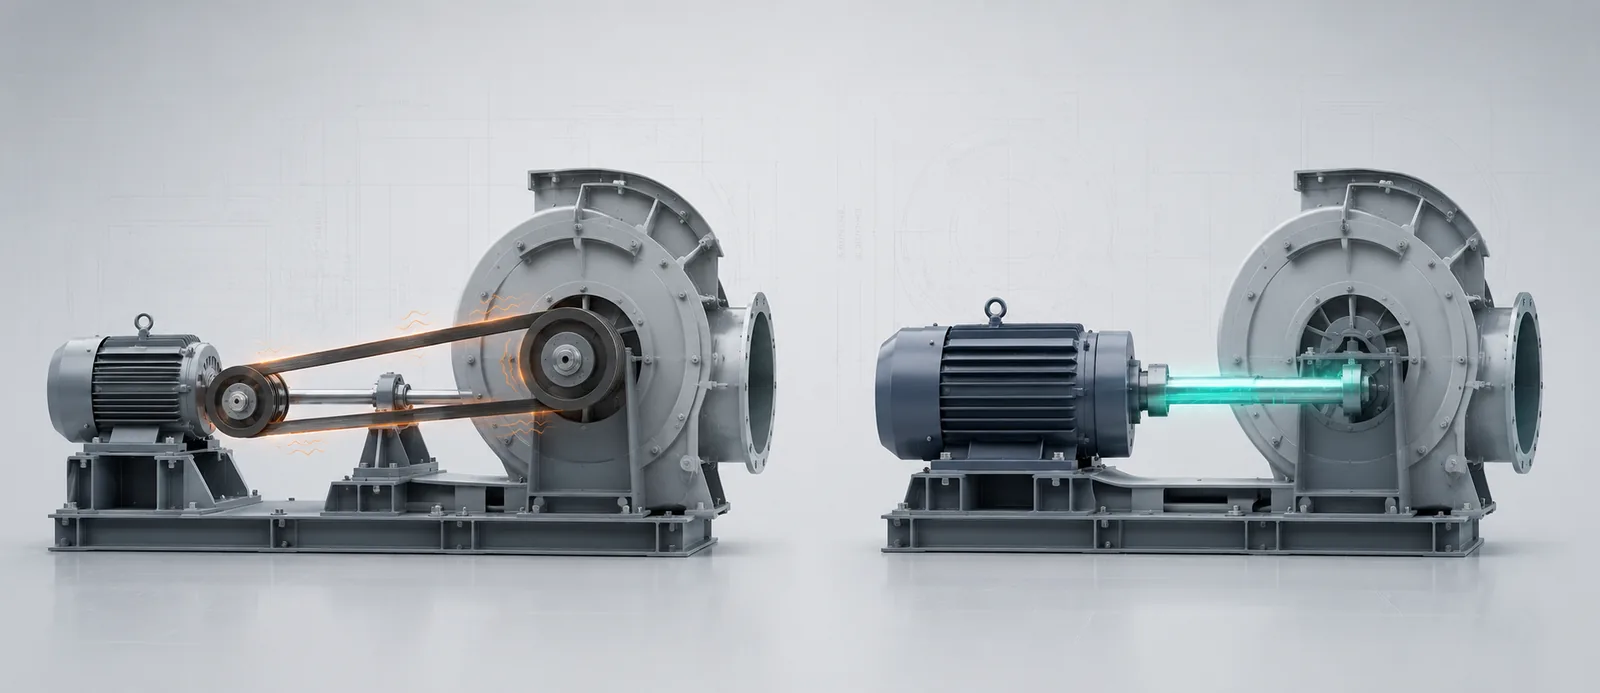
The motor couples straight to the impeller, removing belts and pulleys — less transmission loss, and the most common wear part is gone.
- Shorter power-transmission path
- No belt slip, ageing or replacement downtime
- Fewer sources of vibration and noise
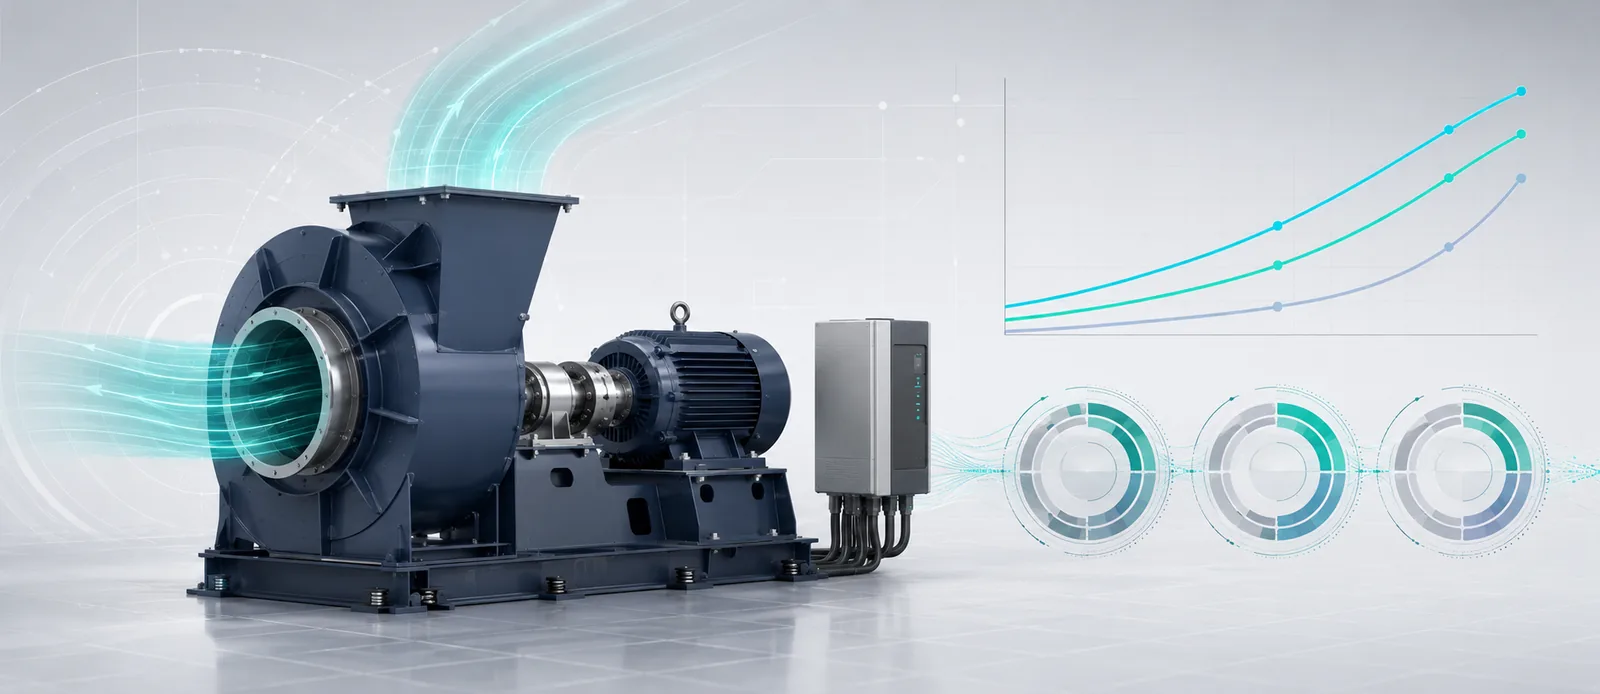
Closed-loop control of speed, flow and pressure: when process load drops, fan speed follows — so you stop paying for peak-condition airflow around the clock.
- Closed-loop, not manual presets
- Automatic turndown during low-load periods
- Every adjustment traceable on the platform
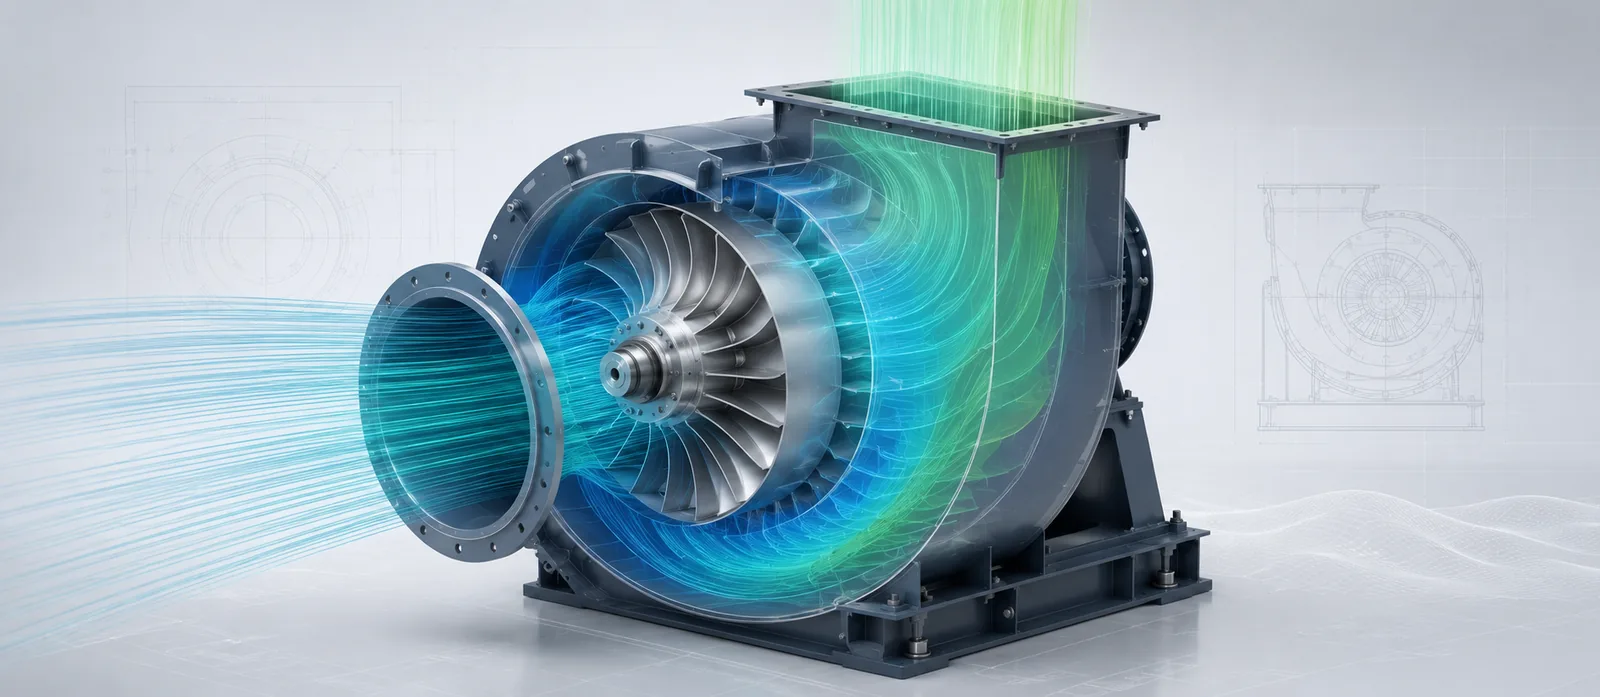
Blades designed along three-dimensional flow surfaces, paired with a tapered volute for smooth guidance — cutting vortices, shock and duct losses so static pressure goes into treatment.
- Less secondary-flow loss inside the blade passage
- Tapered volute reduces shock loss
- Higher useful output under the same conditions
Fan affinity laws, explained with one slider
Drag the slider to see how flow, pressure and shaft power relate as speed changes.
These are the theoretical affinity-law relationships. Actual savings depend on system resistance, equipment efficiency and control strategy, and are confirmed by on-site measurement.
Not a replacement fan — an upgraded system
Belts wear out, frequent downtime · no data · the energy baseline
Less maintenance · some local data · partial saving
Early alerts cut downtime · 24/7 monitoring, savings measurable
Savings are an accounting question, not a marketing one
Every project's saving rate is calculated through the four steps below, and the result goes into the acceptance documentation — the same standard every figure on our case studies must meet.
Want to check the savings potential at your own site?
Book an on-site energy diagnosis — we'll walk you through how the baseline is measured and how the result is verified.